ML.NET and Python Multiple Linear Regression

This is the third in a series talking about the differences in implementation between ML.NET and Python for machine learning tasks. Don't worry though, you should be able to jump right in to read this post.
What is Multiple Linear Regression
It is the same thing as simple linear regression but with many more variables.
Also, data for a successful linear regression must adhere to some core assumptions.
I list these assumptions out in another article. However, understanding these will not be necessary for the ML.NET vs Python implementation comparison. Our data can be assumed to meet the requirements this time.
The Data
This data represents a bunch of different startups. Our goal is to predict the profit of a startup.
| R&D Spend | Administration | Marketing Spend | State | Profit | |
|---|---|---|---|---|---|
| 165349.2 | 136897.8 | 471784.1 | New York | 192261.83 | |
| 162597.7 | 151377.59 | 443898.53 | California | 191792.06 | |
| 153441.51 | 101145.55 | 407934.54 | Florida | 191050.39 | |
| 144372.41 | 118671.85 | 383199.62 | New York | 182901.99 | |
| 142107.34 | 91391.77 | 366168.42 | Florida | 166187.94 | |
| 131876.9 | 99814.71 | 362861.36 | New York | 156991.12 | |
| 134615.46 | 147198.87 | 127716.82 | California | 156122.51 | |
| 130298.13 | 145530.06 | 323876.68 | Florida | 155752.6 | |
| 120542.52 | 148718.95 | 311613.29 | New York | 152211.77 | |
| 123334.88 | 108679.17 | 304981.62 | California | 149759.96 | |
| 101913.08 | 110594.11 | 229160.95 | Florida | 146121.95 | |
| 100671.96 | 91790.61 | 249744.55 | California | 144259.4 | |
| 93863.75 | 127320.38 | 249839.44 | Florida | 141585.52 | |
| 91992.39 | 135495.07 | 252664.93 | California | 134307.35 | |
| 119943.24 | 156547.42 | 256512.92 | Florida | 132602.65 | |
| 114523.61 | 122616.84 | 261776.23 | New York | 129917.04 | |
| 78013.11 | 121597.55 | 264346.06 | California | 126992.93 | |
| 94657.16 | 145077.58 | 282574.31 | New York | 125370.37 | |
| 91749.16 | 114175.79 | 294919.57 | Florida | 124266.9 | |
| 86419.7 | 153514.11 | 0 | New York | 122776.86 | |
| 76253.86 | 113867.3 | 298664.47 | California | 118474.03 | |
| 78389.47 | 153773.43 | 299737.29 | New York | 111313.02 | |
| 73994.56 | 122782.75 | 303319.26 | Florida | 110352.25 | |
| 67532.53 | 105751.03 | 304768.73 | Florida | 108733.99 | |
| 77044.01 | 99281.34 | 140574.81 | New York | 108552.04 | |
| 64664.71 | 139553.16 | 137962.62 | California | 107404.34 | |
| 75328.87 | 144135.98 | 134050.07 | Florida | 105733.54 | |
| 72107.6 | 127864.55 | 353183.81 | New York | 105008.31 | |
| 66051.52 | 182645.56 | 118148.2 | Florida | 103282.38 | |
| 65605.48 | 153032.06 | 107138.38 | New York | 101004.64 | |
| 61994.48 | 115641.28 | 91131.24 | Florida | 99937.59 | |
| 61136.38 | 152701.92 | 88218.23 | New York | 97483.56 | |
| 63408.86 | 129219.61 | 46085.25 | California | 97427.84 | |
| 55493.95 | 103057.49 | 214634.81 | Florida | 96778.92 | |
| 46426.07 | 157693.92 | 210797.67 | California | 96712.8 | |
| 46014.02 | 85047.44 | 205517.64 | New York | 96479.51 | |
| 28663.76 | 127056.21 | 201126.82 | Florida | 90708.19 | |
| 44069.95 | 51283.14 | 197029.42 | California | 89949.14 | |
| 20229.59 | 65947.93 | 185265.1 | New York | 81229.06 | |
| 38558.51 | 82982.09 | 174999.3 | California | 81005.76 | |
| 28754.33 | 118546.05 | 172795.67 | California | 78239.91 | |
| 27892.92 | 84710.77 | 164470.71 | Florida | 77798.83 | |
| 23640.93 | 96189.63 | 148001.11 | California | 71498.49 | |
| 15505.73 | 127382.3 | 35534.17 | New York | 69758.98 | |
| 22177.74 | 154806.14 | 28334.72 | California | 65200.33 | |
| 1000.23 | 124153.04 | 1903.93 | New York | 64926.08 | |
| 1315.46 | 115816.21 | 297114.46 | Florida | 49490.75 | |
| 0 | 135426.92 | 0 | California | 42559.73 | |
| 542.05 | 51743.15 | 0 | New York | 35673.41 | |
| 0 | 116983.8 | 45173.06 | California | 14681.4 |
We can see as independent variables we have R&D Spend, Administration, Marketing Spend, and the State in which the startup operates. The dependent variable is the Profit.
Multiple Linear Regression in Python
As usual, we start by importing our libraries and reading in the data.
import numpy as np
import matplotlib.pyplot as plt
import pandas as pd

dataset = pd.read_csv('50_Startups.csv')
X = dataset.iloc[:, :-1].values
y = dataset.iloc[:, -1].values
Now, however, we need to do a data transformation. The State column cannot be represented as a string. Instead we're going to use methods imported from the sklearn library to transform it into three columns, a column for each State. The method that does the majority of the work here is OneHotEncoder. Now we can represent this data numerically.
You might wonder why a single column with values of 1, 2, and 3 are not used. The answer is that the ML algorithm will then seek to order those values even though there is no real ordering of States in that way. Making each State it's own column eliminates that bias.
from sklearn.compose import ColumnTransformer
from sklearn.preprocessing import OneHotEncoder
ct = ColumnTransformer(transformers=[('encoder', OneHotEncoder(), [3])], remainder='passthrough')
X = np.array(ct.fit_transform(X))

Aside from that small change the steps are now almost identical to simple linear regression.
We now split into training and test sets.
from sklearn.model_selection import train_test_split
X_train, X_test, y_train, y_test = train_test_split(X, y, test_size = 0.2, random_state = 0)
We train the model using the exact same function as we used for simple linear regression. The LinearRegression function is capable of training models for simple and multiple regression.
from sklearn.linear_model import LinearRegression
regressor = LinearRegression()
regressor.fit(X_train, y_train)
And we can predict the results as normal.
y_pred = regressor.predict(X_test)
Lets see what the results were. Rather than chart the data we will transform it into two columns. The first column will be the predicted profits and the second will be actual profits.
np.set_printoptions(precision=2)
print(np.concatenate((y_pred.reshape(len(y_pred),1), y_test.reshape(len(y_test),1)),1))
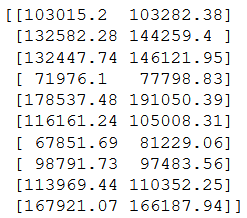
Some of the predictions are pretty good while others are just sort of okay. Nevertheless, given the small sample this is a pretty good result for a multiple linear regression model. It's nice that there are few extra steps to train this model in spite of the fact that the data is much more complex relative to simple linear regression.
In fact, lets calculate the RSquared value as this will be relevant when we look at ML.NET. The RSquared value is a metric we can use to calculate the accuracy of a trainer algorithm.
from sklearn.metrics import r2_score
print(r2_score(y_test, y_pred))
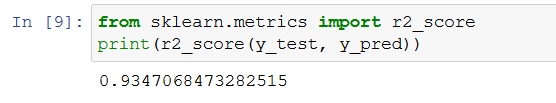
The score for this regression is 0.9347068473282515, which is quite good given that we have a small data set. The goal for an RSquared score should be to get as close to 1 as possible. Scores at .5 or below means the model is more or less guessing for the prediction.
Multiple Linear Regression in ML.NET
Right away we start to see some major differences. First off, the algorithm detection experiment from the command-line tool shows some less than encouraging results for the proposed model.
We can get this output by running the command-line tool against our dataset with this command.
mlnet regression --dataset .\50_Startups.csv --label-col Profit
You can read more about the command-line tool here.
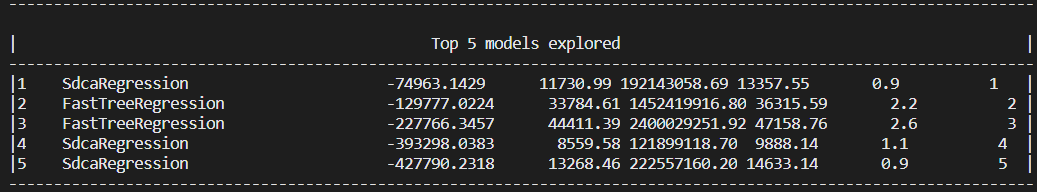
The columns are not labeled at this stage of the output, but they are AlgorithmName, RSquared, Absolute-loss, Squared-loss, RMS-loss, Duration, Iteration. You can read about how to interpret these results from Microsoft's guide.
But here we are getting negative values for our RSquared values and our other metrics are equally bad. So already things are not equivalent to Python. However, the command-line experiment still did narrow down to the top two training algorithms used for regression.
- SdcaRegression
- FastTreeRegression
Also, recall that in Python we used OneHotEncoder to transform the State column such that it could be more easily used by the training algorithm. At this stage, it's unclear if ML.NET has done the same transformation - although judging by the analysis output it would appear it has not.
Lets run a quick and dirty test to see if that column is the cause of our bad data by deleting the state column and running the command-line test again.
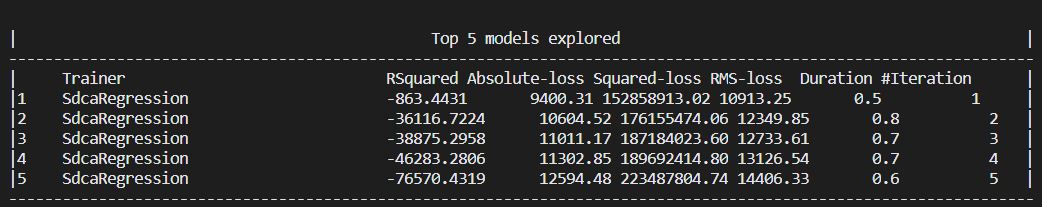
We see an improvement in that the negative numbers are smaller - but still not the kind of output we would like.
This indicates that the dataset is either too small for the mlnet command-line tool to create or that there is some other issue with the data that causes the mlnet command-line experiment to be no better than a guess as it regards making predictions based on this data.
But lets forgive the command-line tool and move on to see if the actual implementation does better. After all, we took our RSquared score for Python after we had completed a full implementation. I'd like to see parity with they Python sklearn LinearRegression trainer function.
Some of these steps are exactly the same as simple linear regression covered in the previous blog post.
First, we download some NuGet packages and set up our using statements. You'll notice I'm pulling in the NuGet package for the FastTree regression as well - that's because I want to experiment between regression trainers once we establish our test and training datasets.
// ML.NET Nuget packages installation
#r "nuget:Microsoft.ML,1.5.0"
#r "nuget:Microsoft.ML.Mkl.Components,1.5.0"
#r "nuget:Microsoft.ML.FastTree,1.5.0"
//Install XPlot package
#r "nuget:XPlot.Plotly,2.0.0"
using Microsoft.ML;
using Microsoft.ML.Data;
using Microsoft.ML.Trainers.FastTree;
using XPlot.Plotly;
using System;
using System.Linq;
Second, we set up our classes for input and output. The Score property for the output is the predicted profit.
public class ModelInput
{
    [ColumnName("R&D Spend"), LoadColumn(0)]
    public float R_D_Spend { get; set; }


    [ColumnName("Administration"), LoadColumn(1)]
    public float Administration { get; set; }


    [ColumnName("Marketing Spend"), LoadColumn(2)]
    public float Marketing_Spend { get; set; }


    [ColumnName("State"), LoadColumn(3)]
    public string State { get; set; }


    [ColumnName("Profit"), LoadColumn(4)]
    public float Profit { get; set; }


}

public class ModelOutput
{
    public float Score { get; set; }
}
Third, we create the MLContext instance and we read in the .csv file to create our test and training sets.
var mlContext = new MLContext(seed: 1);

IDataView trainingDataView = mlContext.Data.LoadFromTextFile<ModelInput>(
    path: @"./50_Startups.csv",
    hasHeader: true,
    separatorChar: ',',
    allowQuoting: true,
    allowSparse: false);

var split = mlContext.Data.TrainTestSplit(trainingDataView, testFraction: 0.2);
These first three steps don't change much aside from the properties in the models. But now we start to see some interesting differences.
var dataProcessPipeline = mlContext.Transforms.Categorical.OneHotEncoding(new[] { new InputOutputColumnPair("State", "State") })
                                      .Append(mlContext.Transforms.Concatenate("Features", new[] { "State", "R&D Spend", "Administration", "Marketing Spend" }));
Ah! Just as Python, we're using a tool called OneHotEncoding. Also, just as Python it transform the encoded columns into multiple columns. However, unlike Python it's more difficult to inspect the data to see what it did.
Let's get to training our model!
I ran the mlnet command-line tool multiple times and ultimately the FastTree regression trainer consistently had the least worst RSquared Score. It reached an RSquared Score in the -800s. Abysmal, but still better than before. In the generated project, we see this is how the regression trainer is added.
var trainer = mlContext.Regression.Trainers.FastTree(new FastTreeRegressionTrainer.Options() { NumberOfLeaves = 2, MinimumExampleCountPerLeaf = 10, NumberOfTrees = 100, LearningRate = 0.06297909f, Shrinkage = 0.0986204f, LabelColumnName = "Profit", FeatureColumnName = "Features" });

var trainingPipeline = dataProcessPipeline.Append(trainer);
We can then train our model.
var trainingPipeline = dataProcessPipeline.Append(trainer);
And now we can perform an evaluation of the trainer. What's the RSquared score now? Keep in mind, RSquared is not the only metric we can evaluate - but it's still a really good one for determining accuracy.
So lets take a look. Here's the code to generate an analysis.
Console.WriteLine("=============== Cross-validating to get model's accuracy metrics ===============");
var crossValidationResults = mlContext.Regression.CrossValidate(split.TrainSet, trainingPipeline, numberOfFolds: 5, labelColumnName: "Profit");
var L1 = crossValidationResults.Select(r => r.Metrics.MeanAbsoluteError);
var L2 = crossValidationResults.Select(r => r.Metrics.MeanSquaredError);
var RMS = crossValidationResults.Select(r => r.Metrics.RootMeanSquaredError);
var lossFunction = crossValidationResults.Select(r => r.Metrics.LossFunction);
var R2 = crossValidationResults.Select(r => r.Metrics.RSquared);

Console.WriteLine($"*************************************************************************************************************");
Console.WriteLine($"*       Metrics for Regression model      ");
Console.WriteLine($"*------------------------------------------------------------------------------------------------------------");
Console.WriteLine($"*       Average L1 Loss:       {L1.Average():0.###} ");
Console.WriteLine($"*       Average L2 Loss:       {L2.Average():0.###}  ");
Console.WriteLine($"*       Average RMS:           {RMS.Average():0.###}  ");
Console.WriteLine($"*       Average Loss Function: {lossFunction.Average():0.###}  ");
Console.WriteLine($"*       Average R-squared:     {R2.Average():0.###}  ");
Console.WriteLine($"*************************************************************************************************************");
And here's the result.
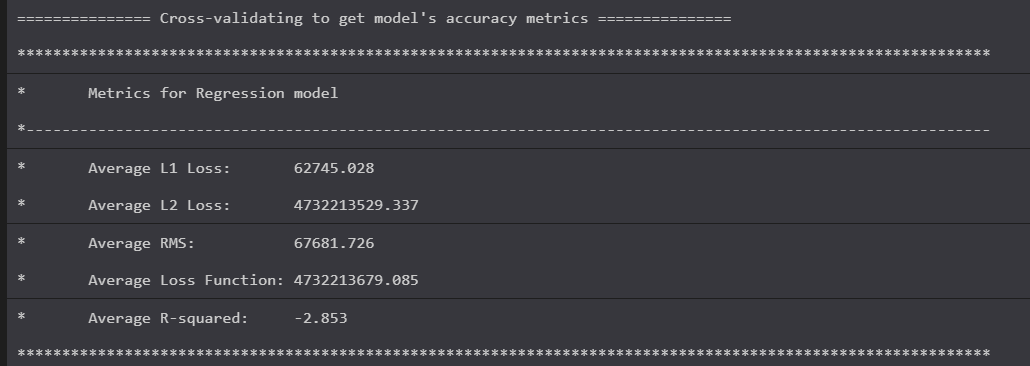
These metrics are still truly awful. Should you actually make predictions on the test set you would see it really is no better than a wild guess at this point. It's not even close to the actual profit.
However, we see something encouraging. The actual implementation does improve the score. RSquared is now a mere -2.853.
It seems at a certain point we cannot trust our mlnet command-line experiments.
After some manual experimentation with some of the regression trainers I was able to generate this:
var dataProcessPipeline = mlContext.Transforms.Categorical.OneHotEncoding(new[] { new InputOutputColumnPair("State", "State") })
                                      .Append(mlContext.Transforms.Concatenate("Features", new[] { "State", "R&D Spend", "Administration", "Marketing Spend" }));

var trainer = mlContext.Regression.Trainers.Ols(labelColumnName: "Profit", featureColumnName: "Features");
var trainingPipeline = dataProcessPipeline.Append(trainer);
That's right, good old Ols regression trainer is back again. It did great for the simple linear regression and it continues to perform well enough for the multiple linear regression example.
It evaluated to this:
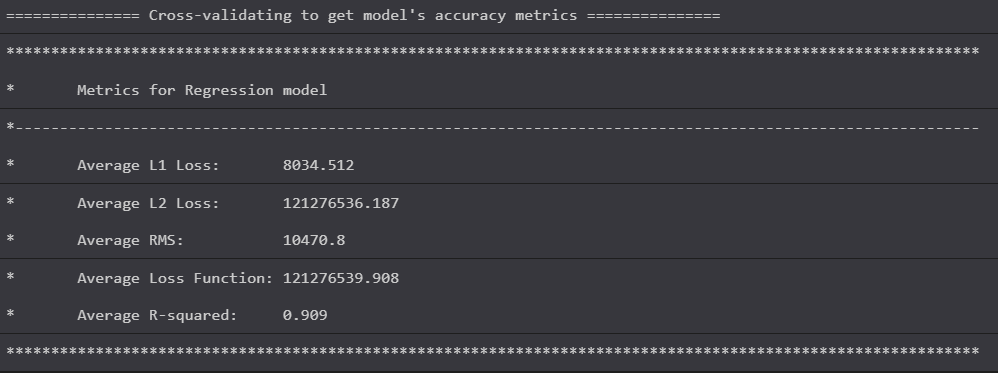
We have an RSquared score of 0.909! This is more or less okay I guess! It's still not as good as the RSquared of the LinearRegression algorithm from sklearn, but we're much closer.
Now if you compare the predicted profit to the actual profit like so -
var predEngine = mlContext.Model.CreatePredictionEngine<ModelInput, ModelOutput>(model);
var testSet = mlContext.Data.CreateEnumerable<ModelInput>(split.TestSet, reuseRowObject:false);
foreach (var ts in testSet)
{
    var testInput = new ModelInput()
    {
        State = ts.State,
        Marketing_Spend = ts.Marketing_Spend,
        R_D_Spend = ts.R_D_Spend,
        Administration = ts.Administration,
        Profit = 0.0F
    };
    var prediction = predEngine.Predict(testInput).Score;
    var actual = ts.Profit;
    Console.WriteLine($"Prediction: {prediction}, Actual: {actual}");
}
We see this -
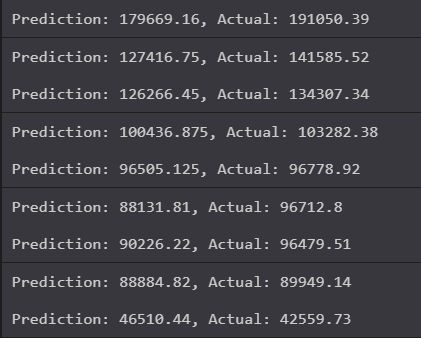
Not bad! Pretty close in some instances! This is a pretty fair prediction of potential profits.
Thoughts
It would be easy, and perhaps accurate, to believe that Python is the better tool for this task.
This is misleading though because the Python steps come from a Udemy course. The data and process were tailored to work well with that ecosystem.
What are we really seeing here then?
ML.NET could still use this data and create predictions that were comparable to the Python predictions. Moreover, the tooling with ML.NET set me on a path where I could figure out for myself which training algorithm to use. The command-line tool did not hand me the answers right away, as it did with simple linear regression - but it set me on a path to figure it out.
Still, the sheer simplicity and ease of use from Python cannot be refuted. In Python's sklearn, we are not hunting for a linear regression training algorithm, there is only one: LinearRegression(). The parameters for that function are documented and intuitive.
With ML.NET, I'm reminded of the game Dwarf Fortress. Dwarf Fortress is well known for it's steep learning curve, but many players find the process of learning fun and rewarding. The value is there, hidden under trial and error. Success is found after a series of hilarious trials and failures.
Also with ML.NET, we also come away with a deeper understanding of what's going on under the hood. As we continue to use it we see opportunities to tweak and change the process to produce better results.
The Python libraries hand us success first and allow us to learn deeply later.
From a business perspective, Python is the clear favorite, at least in the short term. The business value will be successful predictions from a process created as cheaply as possible. However, in the long term a business would benefit from type safety and the resulting easier maintenance.
We'll see how ML.NET performs next to Python in my next post which will be looking at the polynomial regression.